Exploring the Cockpit of an Airliner 5.4 Instrument Approach Charts
Let’s briefly summarize the instrument approach procedure using the approach chart, taking the ILS Z RWY34L (CAT II) procedure at Tokyo International Airport as an example.
Approach refers to the process of aligning the aircraft with the Runway during Descent. During the approach phase, the aircraft must adjust its altitude and align with the Runway to avoid ground obstacles. Pilots must maintain high concentration to operate accurately; therefore, approaches have strict standards and operating procedures. The “ILS Z RWY34L (CAT II)” mentioned above refers to the first (Z, with the second named Y and the third named X) instrument approach procedure name when entering Runway 34L at Tokyo International Airport.
Based on whether vertical guidance is provided during the final approach segment, approach procedures are divided into two major categories: Precision Approach and Non-Precision Approach. Navigation facilities used for precision approach guidance include the Instrument Landing System ILS (commonly known as the blind landing system), Microwave Landing System MLS, and Precision Approach Radar PAR. Non-precision approach equipment includes VOR, NDB, LOC, GPS, etc. ILS should be a well-known automatic landing system, so the ILS Zulu RWY34L (CAT II) approach chart introduced in this section uses the precision approach ILS procedure as an example.
The approach phase generally includes the following stages: Initial (from the Initial Approach Fix IAF to the Intermediate Fix IF, the transition from arrival to approach, turning the aircraft towards the Runway direction based on navigation equipment), Intermediate (from IF to the Final Approach Fix FAF, maintaining a Track consistent with the Runway direction, Level Flight, adjusting speed and attitude to smoothly enter the final approach), Final Approach (from FAF to the Missed Approach Point, descending along the landing Track, aligning with the Runway centerline, descending to the Decision Altitude), and Missed Approach.
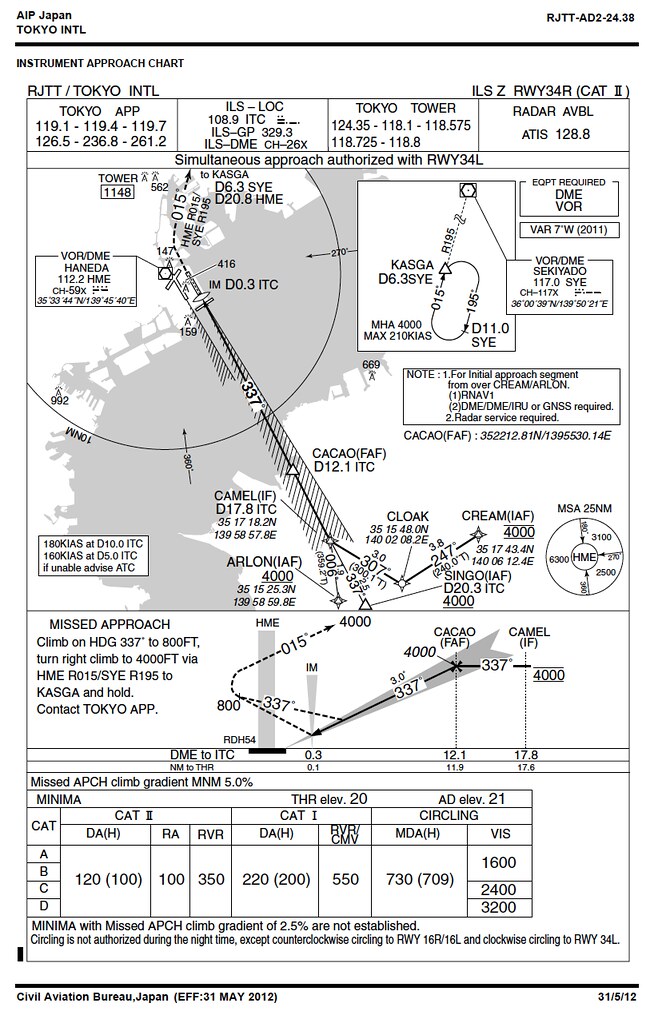
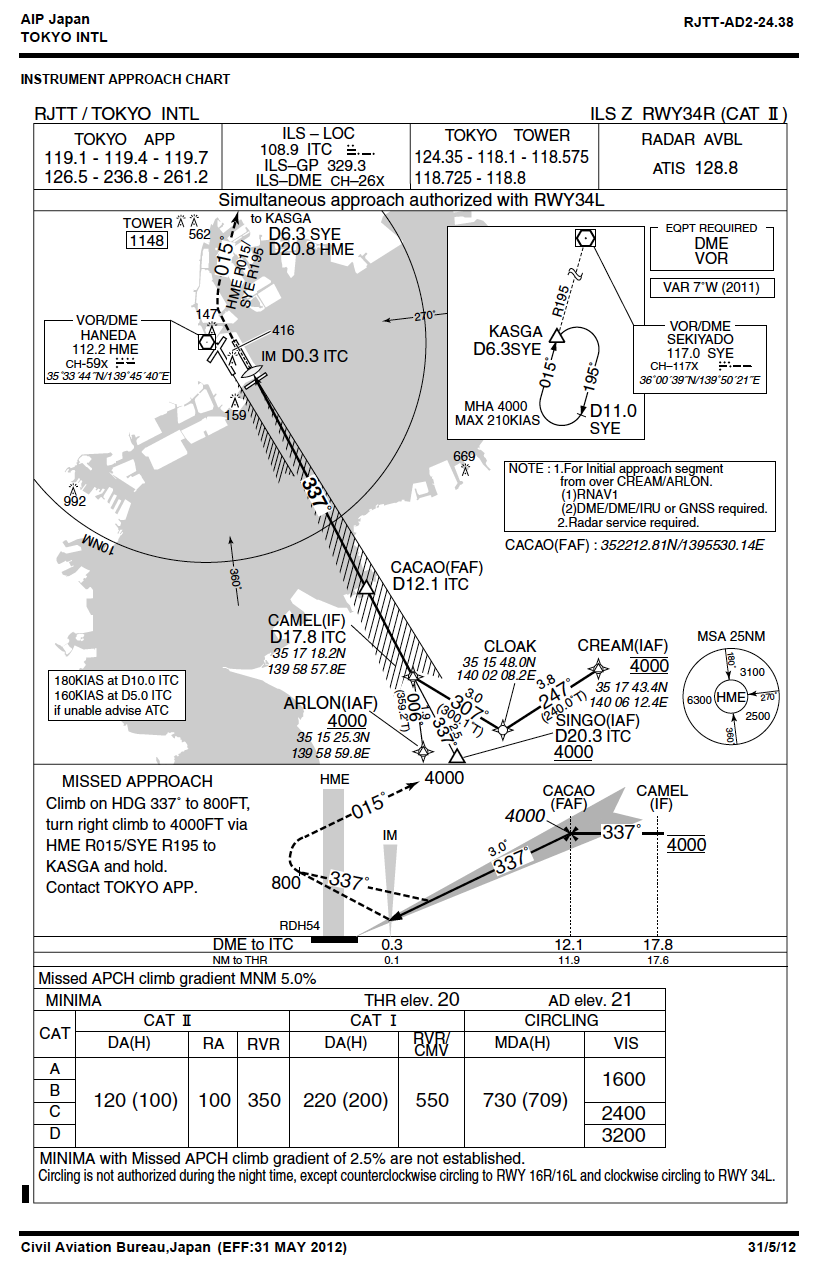
The instrument approach chart is a graphical representation of the instrument approach procedure, including an information bar, plan view, profile view, and landing minimums.
First, look at the information bar at the very top, which provides the communication frequencies required by the pilot.
The first item, TOKYO APP (Tokyo Approach Control), has a total of 6 frequencies: 119.1-119.4-119.7-126.5-236.8-261.2MHz. The specific frequency to be used depends on the assignment by ATC during arrival.
The second item is the navigation equipment frequency information. The frequency for the ILS-LOC (Localizer) station is 108.9MHz. The following “ITC” is the identification code for Runway 34L, and its Morse code is also listed. When the airborne navigation equipment captures the radio signal, the pilot must also monitor the Morse code to confirm that the tuned frequency is correct.
LOC (short for Localizer) is a subsystem of ILS that provides horizontal guidance, allowing the aircraft to fly correctly on the extension of the Runway centerline. ILS-LOC frequency: 108.9MHz.
GP (short for Glide Path, sometimes called Glide Slope) is another subsystem of ILS, providing vertical guidance so that the aircraft can land at the correct angle. ILS-GP frequency is 329.3MHz.
In addition, the carrier frequencies of the localizer and glide slope are paired, so selecting the frequency once tunes both receivers.
At the bottom, CH-26x is the code for the ILS-DME distance measuring equipment. DME is also a device equipped at the airport that provides the pilot with the straight-line distance (slant range) from the aircraft to the Runway in nautical miles.

The third item is the Tower Air Traffic Control frequency. There are 5 here: 124.35-118.1-118.575-118.725-118.8MHz. Specific usage also requires contacting Approach Control. Generally, each frequency corresponds to a specific Runway and usually does not change.
The fourth item is the ATIS broadcast frequency mentioned in Section 5.1 Descent Preparation, which is 128.8MHz here.
Next, let’s look at the plan view section. The plan view generally provides a map of the approach procedure, including terrain, navigation facility information, Track information, various Fixes, etc.
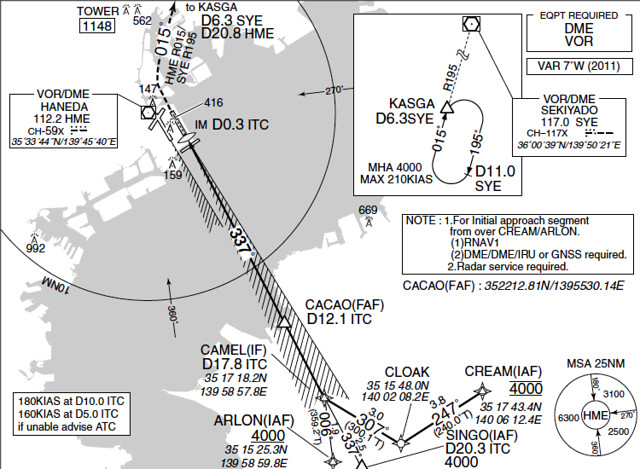
First, the gray area in the center of the plan view refers to Tokyo Bay, while Tokyo International Airport is located in the upper left of the map. The arc lines centered on the airport indicate the range of the airport tower control zone. The map above is a bit small and may be hard to see clearly; you can click here to see the enlarged image. In the upper left corner of the map, there is the text “TOWER 1148”. This should be the marker for the famous Tokyo Tower, with an elevation of 1148 feet.
The course of the ILS Instrument Landing System is represented in the map by a large arrow with feathered short lines, which is very eye-catching. Its direction follows the approach direction, pointing towards the Runway threshold. The text “IM” next to the arrow indicates the position of the Inner Marker IM. The Inner Marker marks the position close to the Runway threshold. “D0.3 ITC” means the distance from the ITC DME here is 0.3 nautical miles. Markers are also a type of ground navigation facility, including the Outer Marker (OM), Middle Marker (MM), and Inner Marker (IM), providing rough distance information of the aircraft relative to the Runway threshold. They are marked as olive-shaped in the plan view.
The bottom right of the plan view gives the Minimum Sector Altitude (MSA) information. Centered on the HME VOR at the airport, the airspace is divided into multiple sectors, and the MSA for each airspace is published separately. The MSA provides pilots with a minimum safe altitude during takeoff Departure and approach landing. The 360°~180° sector is 6300 feet, the 180°~270° sector is 3100 feet, and the 270°~360° sector is 2500 feet. In this map, 3 sectors are visible. The sector minimum altitude on the west side of the airport is significantly higher than that on the east because the west of the airport is downtown Tokyo, while the east is Tokyo Bay over the sea. There are obviously many more obstacles on the west side than on the east, so the safe altitude must be much higher.
The approach Track is drawn with a thick solid line in the plan view. The Initial Approach Fix (IAF) serves as the starting point of the Track. Three can be found in the lower middle of the plan view above: the CREAM, SINGO, and ARLON fixes. The map shows the latitude and longitude and minimum safe altitude information for each fix. The altitude here is 4000 feet, so during the Descent process, the pilot must maneuver the aircraft to lower the altitude to 4000 feet or above when reaching the IAF. The SINGO IAF also marks the distance from that fix to the ITC DME; “D20.3 ITC” indicates that this location is 20.3 nautical miles from the airport.
The missed approach Track is drawn with a dashed line with an arrow at the end. It can be seen in the upper left of the map above, turning to a 15-degree azimuth along the Runway direction; the Track “to KASGA” is the missed approach route.
Magnetic course information is marked on the Track lines. For example, the Track between CREAM and CLOAK is a magnetic Heading of 247 degrees, from CLOAK to CAMEL is 307 degrees, from ARLON to CAMEL is 006 degrees, and from SINGO to CAMEL is 337 degrees. At the same time, the true course is marked in small font below the magnetic course, noted by the capital letter T after the value, such as the Track from CREAM to CLOAK being a true Heading of 240 degrees, etc.
Distance information between fixes is also provided above the course angles. For example, the distance between CREAM and CLOAK is 3.8 nautical miles, between CLOAK and CAMEL is 3 nautical miles, between ARLON and CAMEL is 1.9 nautical miles, and between SINGO and CAMEL is 2.5 nautical miles.
Two other important fixes during the approach are the Intermediate Fix (IF) and the Final Approach Fix (FAF). Aircraft arriving from different directions adjust their Heading via different IAFs, converge at the IF, continue flying to the FAF, and then the aircraft enters the final process of landing along the ILS glide path.
In the NOTE on the right side of the plan view, there are precautions for using this approach procedure. One is that aircraft using the CREAM and ARLON Initial Approach Fixes must be equipped with Area Navigation or navigation equipment such as DME/IRU/GUSS. The other is that radar guidance must be obtained in advance.
The lower left of the map also indicates speed limit information. The speed limit at a distance of 10 nautical miles (approx. 18 km) from the ITC DME is 180 knots (approx. 330 km/h), and the limit at 5 nautical miles (approx. 9 km) is 160 knots (approx. 300 km/h).
Below is the profile view section of the approach chart. The profile view visually represents the flight Track of the approach procedure in a three-dimensional view, generally including the descent Track, various airspace fixes, recommended descent altitudes, and missed approach icons.
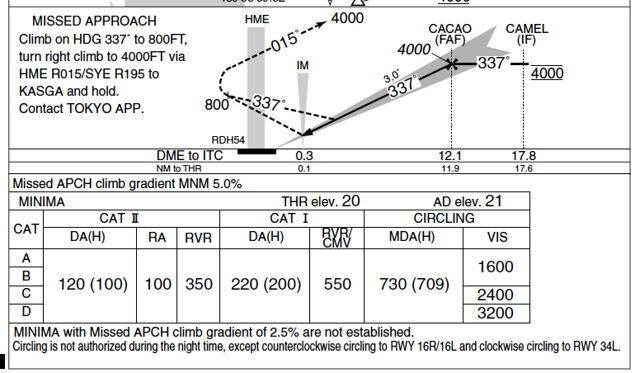
The descent Track in the image above is represented by a thick solid line with arrows from right to left, starting from the Intermediate Fix IF CAMEL, flying towards the FAF CACAO, down to the Inner Marker IM. The recommended flight altitude at IF is 4000 feet, and the distance from ITC is 17.8 nautical miles (17.6 nautical miles from the Runway threshold).
From IF to FAF, the aircraft maintains Level Flight at a magnetic Heading of 337 degrees. Upon reaching the Final Approach Fix FAF at a distance of 12.1 nautical miles from the ITC DME (11.9 nautical miles from the Runway threshold) (the FAF for non-precision approach procedures is marked with a Maltese Cross symbol in the chart, but the start of the final approach segment for precision approach procedures is called the Final Approach Point FAP, and its position is generally not marked with any symbol in the chart), the descent begins. The vertical navigation descent line terminates at the Inner Marker IM. The chart shows the vertical navigation glide angle is 3.0 degrees, and the magnetic Heading is 337 degrees.
The Missed Approach Point is the position in the instrument approach procedure where the required visual reference has not been obtained and a missed approach must be initiated. The missed approach Track is represented by a dashed line with arrows in the chart. In a precision approach procedure, the missed approach point is the position corresponding to the Decision Altitude as the aircraft descends along the glide path. For a non-precision approach procedure, the missed approach point is represented by a navigation station or the distance from the navigation station. When executing a missed approach, you must maintain a magnetic Heading of 337 degrees and Climb to 800 feet, then turn right to intercept the HME VOR 15-degree / SYE VOR 195-degree radial and Climb to 4000 feet, joining the holding procedure at the KASGA fix. The holding procedure information is noted in the upper right of the plan view.
Below the profile view is the Landing Minimums table, which provides the landing standards that must be met during the approach, serving as a limiting condition for transitioning to visual approach landing. The minimums include minimum altitude and minimum visibility (VIS) or Runway Visual Range (RVR). For precision approaches, the minimum altitude is Decision Altitude (DA) and Decision Height (DH), while for non-precision approaches, the minimum altitude is Minimum Descent Altitude (MDA) and Minimum Descent Height (MDH). Forcing a landing when the weather is poor and the Runway surface cannot be seen clearly during the final stage of an ILS approach often leads to major flight accidents. Therefore, pilots must strictly observe the landing minimums for each approach procedure. If the visual reference required for the approach has not been established before passing the Decision Altitude, a Go Around must be initiated at the Decision Altitude.
DA is based on mean sea level, while DH is based on the Runway threshold elevation. DH is used for precision approaches of ILS CAT II and above, that is, when DH is below 200ft. In this case, a radio altimeter should be used instead of a barometric altimeter.
It can be seen here that for a straight-in approach landing, the DA for CAT II ILS is 120 feet, DH is 100 feet, Radio Altitude RA is 100 feet, and RVR is 350 meters. For CAT I, DA is 220 feet, DH is 200 feet, and RVR is 550 meters. For visual circling landing, MDA is 730 feet, MDH is 709 feet, and visibility varies by aircraft category: 1600 meters for Categories A and B, 2400 meters for Category C, and 3200 meters for Category D.
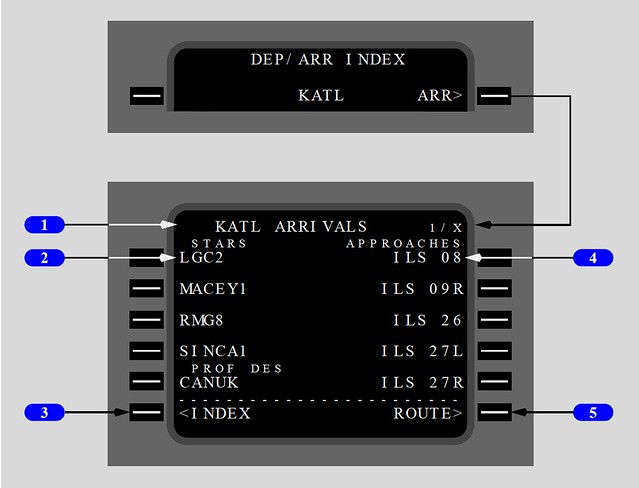
Modern airliners’ flight databases contain complete arrival and approach data. Pilots only need to select the required airport arrival procedure, approach procedure, and Runway in the CDU to see all route information updated to the landing Runway on the route page of the CDU.
Finally, for reference, the blind landing categories and aircraft category definitions are transcribed as follows: The Instrument Landing System is divided into several categories based on precision:
| Category | Decision Height | Runway Visual Range |
| CAT I | Above 200ft | Above 550m or Visibility above 800m |
| CAT II | Above 100ft and below 200ft | Above 350m |
| CAT IIIA | Below 100ft or no Decision Height | Above 200m |
| CAT IIIB | Below 50ft or no Decision Height | Above 75m and below 200m |
| CAT IIIC | No Decision Height | No Runway Visual Range limitation |
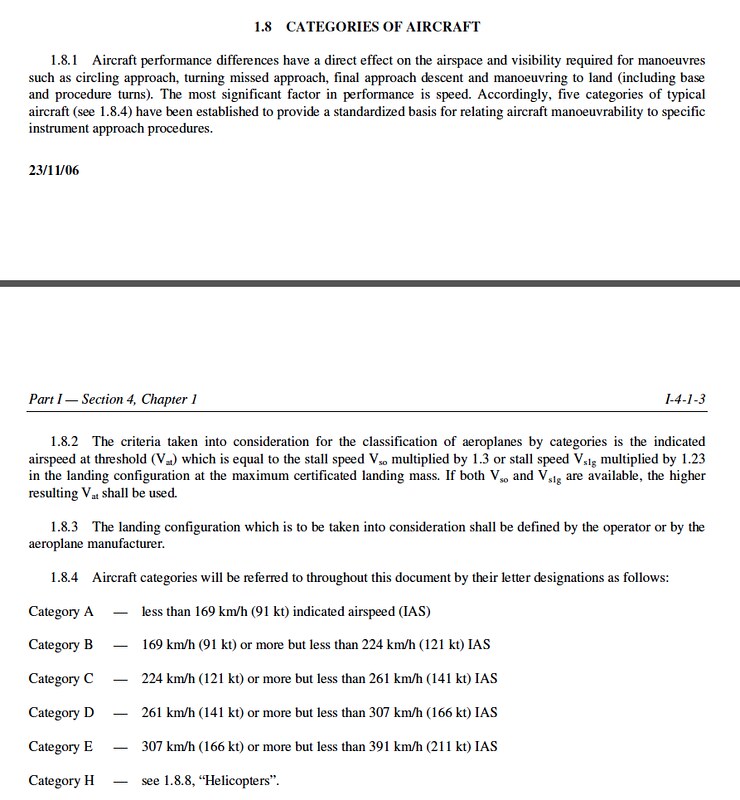
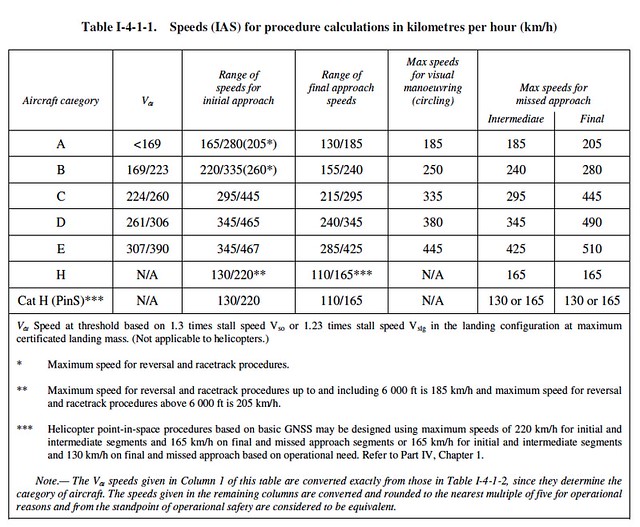
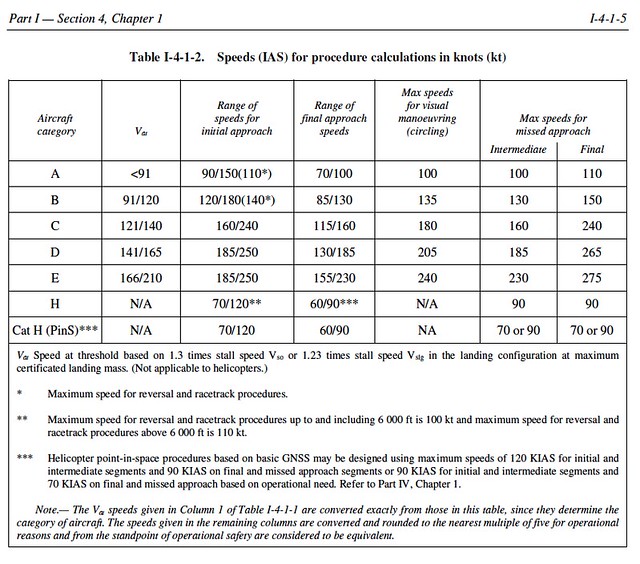
The approach speed of an aircraft directly affects the airspace and visibility required for various maneuvers in the instrument approach procedure. To provide a standardized basis for aircraft maneuvering possibilities for specific instrument approach procedures, ICAO classifies aircraft into five categories based on the landing configuration at maximum allowable landing weight and the speed Vat at the Runway threshold: ● Category A: Indicated Airspeed less than 169km/h; ● Category B: Indicated Airspeed 169km/h or more, but less than 224km/h; ● Category C: Indicated Airspeed 224km/h or more, but less than 261km/h; ● Category D: Indicated Airspeed 261km/h or more, but less than 307km/h; ● Category E: Indicated Airspeed 307km/h or more, but less than 391km/h.
Regarding aircraft category classification, I have posted the explanation section from ICAO Doc 8168 OPS/611 Aircraft Operations for everyone’s reference.
End
Prev: STAR Standard Instrument Arrival TOC: Table of Contents Next: Begin Descent